
Mainnavigation
Subnavigation
BORDER
Pagecontent
Animation of Comm Links for GlobalStar
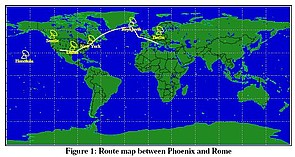
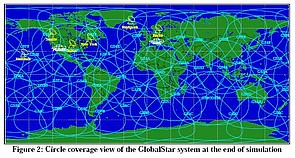
The two SatLab maps below come from an analysis of a communication system using the GlobalStar stellite syste. This system has 6 earth stations, two communicating locations (Phoenix and Rome . Routes are calculated with the Diklstra routing algorithm and displayed on the animated map. The first map below shows the routing at the end of the simulation, the second map shows the coverage of GlobalStar satellites at the end of the simulation. The two communicating locations(Phoenix and Rome) are shown on the map.
function demoRouteEStar
    %
    % demoRouteEStar
    %
    % This demo loads the satellite system GlobalStar
    % with 6 ES and 2 MS and simulates this system over
    % 10 min. In the demo the routing paths between Phoenix
    % and Rome and between Rome and Phoenix are shown.
    % The used routing algorithm is the Dijkstra algorithm
    % and routing is only possible between MS and LEO
    % satellites for the uplink, between satellites and MS
    % for the downlink, between satellites and ES for
    % up/down link and between ES for cross links
    %
    % Author : Horst Salzwedel

    loadreplaceAll("./EStar.data");

    %addStation("Buenos Aires",I_earth,0.00-34.57,-58.05,0.01);
    setSimEpoch(2000,3,26,8,0,0);

    ES1 = "Honolulu";
    ES2 = "Seattle";
    ES3 = "Dallas";
    ES4 = "New York";
    ES5 = "Reykjavik";
    ES6 = "Berlin";
    MS1 = "Phoenix";
    MS2 = "Rom";

    t = 0:10:200;

    % initialize values for Iridium
    earth1 = NodeNumber(MS1) + 1;
    earth2 = NodeNumber(MS2) + 1;

    % other values
    n   = NumberOfNodes(4);
    nES = NumberOfNodes(1);
    nMS = NumberOfNodes(2);
    nS  = nES + nMS;

    % open display
    id   = 1;
    iLEO = nS + 1;
    z    = zeros(n-iLEO+1);

    % time steps
    for i1 = 1:max(size(t))
        tnow=t(i1);
        clearGraphic(id);
        setSimTime(tnow);
        g_all=GeoPosition(4)*r2d;
        [d,r,a,el,v] = RelPosition ();

        % visibility between ES
        v(1:6,1:6) = [1 1 0 0 0 0
                      1 1 1 0 0 0
                      0 1 1 1 0 0
                      0 0 1 1 1 0
                      0 0 0 1 1 1
                      0 0 0 0 1 1];
        v(iLEO:n,iLEO:n) = z;

        % cost = 10E10*ones(104);
        cost = zeros(104);
        cost(1:56,1:56) = d.*v;
        cost(1:6,57:104) = cost(1:6,9:56);
        cost(57:104,7:8) = cost(9:56,7:8);

        % routing
        routes1 = RoutingDijkstra(cost,earth1,earth2);
        nr = max(size(routes1));

        for j=1:nr
            if (routes1(j) > 56)
                routes1(j) = routes1(j) - 48;
            endif
        endfor

        setLineColor(id,"white");
        lon1 = g_all(2,routes1);
        lat1=g_all(1,routes1);
        drawPline(id,lon1,lat1);

        % end of routing calculation
    endfor

    fprintf(stdout, "press space ...\n"), pause();
    demos

%endfunction