
Mainnavigation
Subnavigation
BORDER
Pagecontent
EOS Power Analysis
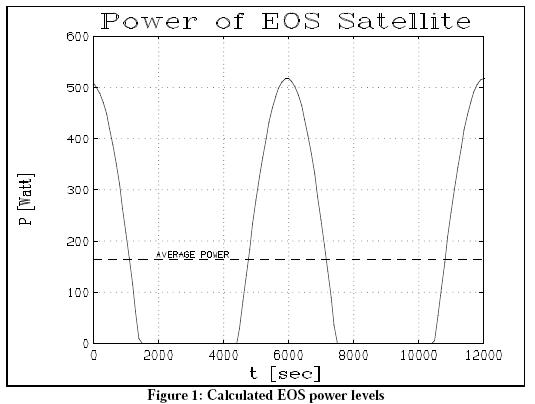
The SatLab graph below analyzes the power output of an Earth Observation Satellite under maximum solar gain. The script that generated this graph is shown below.
% Demo: EOS satellite
%
% This demo sets up a satellite for earth observation that passes
% over the earth at noon for optimum light conditions
%

removeAll;
clearGraphic();
setSimEpoch(2000,3,21,12,0,0);
addEpoch('equinox',2000,3,21,12,0,0);
addSatellite('EOS Sat',7171,0,98,0,0,0,'equinox');

%earthstation
earth0 = "Frankfurt";
addStation('Frankfurt', I_earth, 10, 50.05, 8.4, 0.1);

dtime      = 100;
alphaleft  = 45 *d2r;
alphatop   = 0 *d2r;
alpharight =-45 *d2r;

setSimTime(0);
setSimStepSize(dtime);
t = 0:dtime:120*dtime;
fleft = rotx(alphaleft) * [ 0
                            0
                           -1 ];

ftop = rotx(alphatop)*    [ 0
                            0
                           -1 ];

fright= rotx(alpharight)* [ 0
                            0
                           -1 ];

z_matrix =
[   0 26.75 27.25 27.75 28.25 28.75 29.25 29.75 30.25 30.75 31.25
  100 12.39 12.23 12.14 12.14 11.95 10.64 10.51 10.33 10.14  9.94
   90 12.67 12.59 12.50 12.39 12.26 11.76 11.68 11.36 11.48 11.36
   80 12.77 12.73 12.68 12.63 12.57 12.31 12.27 12.22 12.17 12.11
   70 12.78 12.76 12.74 12.71 12.68 12.55 12.53 12.51 12.48 12.45
   60 12.74 12.73 12.72 12.71 12.69 12.63 12.62 12.61 12.60 12.68
   50 12.68 12.68 12.67 12.67 12.66 12.63 12.63 12.62 12.62 12.91
   40 12.61 12.61 12.61 12.61 12.60 12.59 12.59 12.79 12.88 13.18
   30 12.53 12.53 12.53 12.53 12.53 12.53 12.57 12.63 12.73 12.72
   20 12.46 12.45 12.45 12.45 12.45 12.45 12.45 12.45 12.65 12.45
   10 12.38 12.38 12.38 12.38 12.38 12.38 12.38 12.38 12.58 12.38
    0 12.30 12.30 12.30 12.30 12.30 12.30 12.30 12.30 12.40 12.30
  -10 12.22 12.22 12.22 12.22 12.22 12.22 12.22 12.22 12.22 12.22
  -20 12.14 12.14 12.14 12.14 12.14 12.14 12.14 12.14 12.14 12.14
  -30 12.06 12.06 12.06 12.06 12.06 12.06 12.06 12.06 12.06 12.06
  -40 11.98 11.98 11.98 11.98 11.98 11.98 11.98 11.98 11.98 11.98
  -50 11.70 11.84 11.90 11.90 11.90 11.90 11.90 11.90 11.90 11.90
  -60 11.32 11.62 11.72 11.82 11.82 11.82 11.82 11.82 11.82 11.82
  -70 11.14 11.24 11.44 11.64 11.74 11.74 11.74 11.74 11.74 11.74
  -80 10.95 10.95 11.35 11.45 11.65 11.65 11.65 11.65 11.65 11.65 ];

j            = 0;
temptop      = 0;
templeft     = 0;
tempright    = 0;
solarflux    = 1420;

alpha        = 0.65;
epsilon      = 0.81;
albedo       = 0.3;
sigma        = 5.67e-8;
capacity     = 660;

qir          = 0;
strings_top  = 4;
strings_side = 10;
eview        = 0.045;
dt           = 60;

dtc          = dt/capacity;
reference_flux_si = 1353;
voltage      = 28;
current      = zeros(size(t));

for i=t,j=j+1;
    stepSim;
    [d,r,a,e,v] = PlanetPosition();
    theta = ftop` * unitvector(a(2),e(2));
    theta = max(0,theta);
    temptop = temptop+((theta*solarflux*alpha)
                      -(epsilon*(temptop^4)*sigma))*(dtc);
    current_top = ((strings_top*theta)
                   *table(z_matrix,(temptop-273.15),voltage)
                   *((solarflux/reference_flux_si)/12));

    theta = fleft` * unitvector(a(2),e(2));
    theta = max(0,theta);
    templeft = (templeft+
               ((((theta*solarflux*alpha)+
                  (theta*solarflux*albedo*alpha*eview))
                -(epsilon*(templeft^4)*sigma)
                +theta*qir)*(dtc)));

    current_left = ((strings_side*theta)*
    table(z_matrix,(templeft-273.15),voltage)
        *((solarflux/reference_flux_si)/12));

    theta = fright` * unitvector(a(2),e(2));
    theta = max(0,theta);
    tempright= (tempright+
               ((((theta*solarflux*alpha)+
                  (theta*solarflux*albedo*alpha*eview))
                -(epsilon*(tempright^4)*sigma)+theta*qir)*(dtc)));

    current_right = ((strings_side*theta)
                    *table(z_matrix,(tempright-273.15),voltage)
                    *((solarflux/reference_flux_si)/12));

    current(j)=current_top+current_left+current_right;
endfor

average=sum(current*voltage)/prod(size(t));
erase

window('111');
plot(t,current*voltage,
     t,ones(size(t))*average, 'grid');
title('Power of EOS Satellite')
ylabel('P [Watt]');
xlabel('t [sec]')
wtext(2000,average+10,'Average Power');